




3. 9. 2026
How to protect forms from online abuse 3. 9. 2026
When to order a dark mode website for businesses so it doesn't fall apart 2. 9. 2026
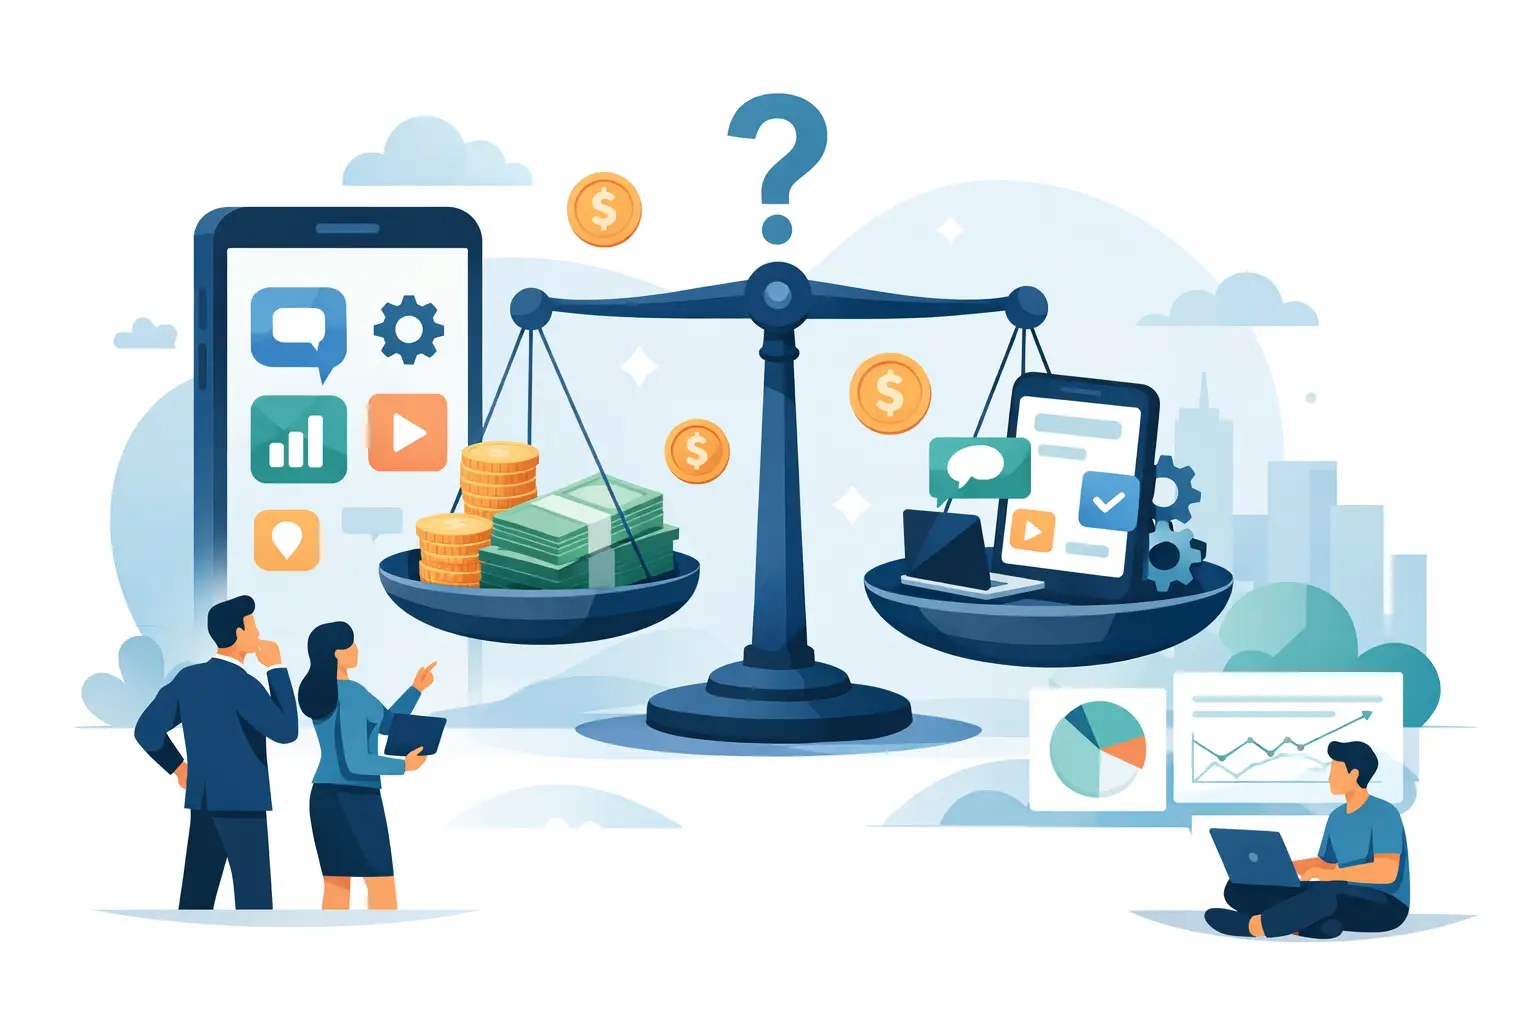
How much does an app cost for your business? 2. 9. 2026
Prevent role explosion: RBAC user roles for IT and development 1. 9. 2026
Time-saving company user portal 1. 9. 2026
Operators: Check RTO, RPO, and site recoverability within 30 days 31. 8. 2026
Best practices for corporate web design 31. 8. 2026
Implement two-factor login in CMS for administrators in four steps 30. 8. 2026
Example of integrating a web application with logistics 30. 8. 2026
Measure in production: Core Web Vitals audit for developers and marketers 29. 8. 2026
Overview of content management tools for businesses 29. 8. 2026
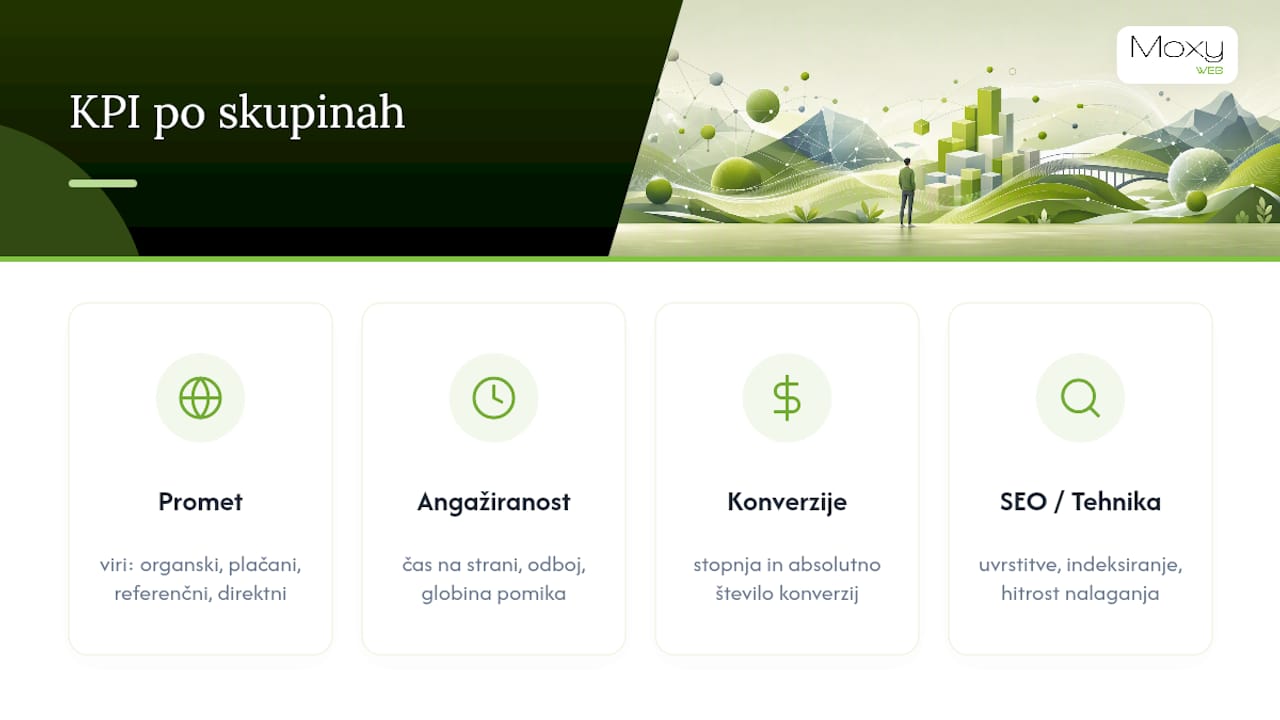
3-5 KPIs for websites and instructions for GA4, GSC and Matomo 28. 8. 2026
What does website accessibility mean for a business? 28. 8. 2026
Legally compliant online store in Slovenia: what you need to arrange 27. 8. 2026
The future of headless online stores in practice 27. 8. 2026
Headless CMS: what is it and who really benefits from it 26. 8. 2026
Web Analytics Guide for Better Decisions 26. 8. 2026
Online store renovation: when is the time and how to start 25. 8. 2026
Example of a user portal for companies 25. 8. 2026
WAF for Web Applications: How It Works and When You Need It 24. 8. 2026
The best portal features for efficient work 24. 8. 2026
Transactional Email in Ecommerce: What to Edit First 23. 8. 2026
Web analytics for better business decisions 23. 8. 2026
Why data is important when building a website 22. 8. 2026
Elements of trust of the decision-making party 22. 8. 2026
User Interface Easy Management Guide 21. 8. 2026
Website data security without the guesswork 21. 8. 2026
What are security protocols for websites and applications? 20. 8. 2026
How to speed up a page without losing functionality 20. 8. 2026
What is user experience and why does management decide about it? 19. 8. 2026
The future of custom development for companies today 19. 8. 2026
Why data backups are important for every business 18. 8. 2026
Best practices for mobile user experience 18. 8. 2026
What is digital transformation and why is it important for businesses? 17. 8. 2026
How to design an administrative user interface 17. 8. 2026
Why SEO is important for marketers and businesses 16. 8. 2026
Optimizing inquiry forms for multiple customers 16. 8. 2026
Page Load Speed: A Business Guide for Decision Makers 15. 8. 2026
Example of a sales-oriented website redesign 15. 8. 2026
SPA or MPA: which architecture suits your project? 14. 8. 2026
Key elements of an effective product page 14. 8. 2026
Mobile first approach: a guide for developers and site owners 13. 8. 2026
UX design for companies with a clear goal 13. 8. 2026
Online advertising for entrepreneurs and marketers in Slovenia 12. 8. 2026
Mobile-friendly business website sales 12. 8. 2026
UX research: what it is and how to conduct it step by step 11. 8. 2026
Best online ordering solutions in practice 11. 8. 2026
Microservices Architecture: An In-Depth Explanation and Decision Guide 10. 8. 2026
How to connect external systems: a practical guide for businesses 10. 8. 2026
Why do I need SSL on my website? 10. 8. 2026
How to edit a multilingual website for foreign markets 9. 8. 2026
What does unique website design mean for businesses? 8. 8. 2026
Online Backup Guide for Businesses 8. 8. 2026
The role of mobile adaptability for businesses in Slovenia 7. 8. 2026
An example of reducing abandoned online shopping carts 7. 8. 2026
Stripe vs PayPal for a Slovenian company: which one to choose? 6. 8. 2026
A guide to revamping your online store without the guesswork 6. 8. 2026
WooCommerce vs Shopify: Which Platform is Right for You? 5. 8. 2026
Dedicated hosting or shared hosting? 5. 8. 2026
What is an SSL certificate and why does your website absolutely need one? 4. 8. 2026
The most important features of a business website 4. 8. 2026
External Systems Integration Guide for Enterprises 3. 8. 2026
Rental platform or your own store for growth? 3. 8. 2026
The best website building tools for businesses 2. 8. 2026
What does monthly website maintenance include? 2. 8. 2026
Business app feature list: top 20 by priority 1. 8. 2026
How to arrange secure website hosting 1. 8. 2026
Types of Hosting for Businesses: A Practical Guide 2026 31. 7. 2026
Project Technical Specification Guide 31. 7. 2026
Website design for companies in Slovenia 30. 7. 2026
Best integrations for online business 30. 7. 2026
Price of website development in Slovenia 2026 29. 7. 2026
How to prepare web application functionalities 29. 7. 2026
Websites for businesses: a guide to making the right decision 28. 7. 2026
Hiring an agency or a freelancer - what to choose? 28. 7. 2026
Editing Websites with WordPress: A Guide 2026 27. 7. 2026
Business Hosting Review for Enterprises 27. 7. 2026
Independent website creation for beginners 26. 7. 2026
The best CMS for business growth is not always the same 26. 7. 2026
Steps to improve website user experience 25. 7. 2026
Manage inventory in your online store without the guesswork 25. 7. 2026
Why automate processes in your company? 24. 7. 2026
When to choose a custom store design? 24. 7. 2026
Benefits of freelance content editing for businesses 23. 7. 2026
Trends in the development of online stores in 2026 23. 7. 2026
Domain Registration Guide: Step by Step 22. 7. 2026
Development of web portals that support growth 22. 7. 2026
What is data security and how to protect data 21. 7. 2026
Custom development or Shopify: what to choose? 21. 7. 2026
The role of analytics in the development of strategic HR management 20. 7. 2026
A guide to developing a custom web application 20. 7. 2026
Digital Presence: Key Steps for Businesses in 2026 19. 7. 2026
A company's digital strategy that brings business 19. 7. 2026
Website Redesign: A Guide for Entrepreneurs 2026 18. 7. 2026
B2B portal that simplifies ordering for customers 18. 7. 2026
Creating a WordPress website for businesses: a guide 2026 17. 7. 2026
How much does it cost to maintain a store per month? 17. 7. 2026
The role of technological innovation for business competitiveness 16. 7. 2026
Custom CMS or WordPress for business growth 16. 7. 2026
List of CMS Platforms for Enterprise: A Guide for Managers 2026 15. 7. 2026
How to choose a web developer without making costly mistakes 15. 7. 2026
Why professional hosting determines the success of a website 14. 7. 2026
WordPress or a custom website for growth? 14. 7. 2026
Examples of modern design: inspiration for projects 2026 13. 7. 2026
Website integration with CRM without losing leads 13. 7. 2026
What is content strategy: a guide for businesses 12. 7. 2026
Example of revamping an outdated website 12. 7. 2026
Benefits of Responsive Design for Businesses in 2026 11. 7. 2026
User experience personalization trends 11. 7. 2026
How to plan your company's digital transformation in 2026 10. 7. 2026
Web application or Excel - what to choose? 10. 7. 2026
Why content management is key to your success 9. 7. 2026
An example of a successful B2B online store 9. 7. 2026
The role of external systems integration in business 8. 7. 2026
Best practices for product filters 8. 7. 2026
The process of creating a graphic image: a guide for 2026 7. 7. 2026
When does a company need a website redesign? 7. 7. 2026
Why use API integrations in business? 6. 7. 2026
Trends in business web systems security 6. 7. 2026
Why user analytics is important for growth 5. 7. 2026
Business online security without empty promises 5. 7. 2026
How to Set Up Hosting for a Business: Guide 2026 4. 7. 2026
Evaluation of CMS solutions for businesses without fogging 4. 7. 2026
What is Graphic Design: A Guide for Businesses 2026 3. 7. 2026
Hire an agency or develop in-house? 3. 7. 2026
What is a domain and why every business needs one 2. 7. 2026
Why a business needs a web application 2. 7. 2026
Why security updates are important in 2026 1. 7. 2026
Content strategy for a business page 1. 7. 2026
Top 4 agency alternatives for novisplet.com 2026 30. 6. 2026
Does a company need its own CMS? 30. 6. 2026
What is Modern Design: A Guide for Businesses 2026 29. 6. 2026
How to choose the right domain for your business 29. 6. 2026
What is a corporate visual identity: a guide for 2026 28. 6. 2026
Overview of online commerce platforms 28. 6. 2026
How to Design Responsive Websites: A 2026 Guide 27. 6. 2026
How to choose an online store structure 27. 6. 2026
Marketing checklist for a company's digital presence 26. 6. 2026
Best features for a B2B portal 26. 6. 2026
What is User Experience Personalization: A Guide 2026 25. 6. 2026
Shopify or custom store? 25. 6. 2026
Digital Strategy Creation Workflow: Guide 2026 24. 6. 2026
What does custom development mean in practice? 24. 6. 2026
How technical support works: a guide for entrepreneurs 23. 6. 2026
What are design standards: a guide for businesses 23. 6. 2026
How long does it take to create a store? 22. 6. 2026
How to prepare a brief for a website 22. 6. 2026
UX Design Best Practices for Digital Professionals 21. 6. 2026
Business Systems Integration Guide 21. 6. 2026
Workflow for digital company presentation: guide 2026 20. 6. 2026
Best solutions for content editing 20. 6. 2026
Why choose custom development for your business? 19. 6. 2026
Landing page design that sells 19. 6. 2026
Tips for easily managing content in your company 18. 6. 2026
Purchase funnel optimization that sells 18. 6. 2026
Top 6 alternatives to moxy-designs.com in 2026 17. 6. 2026
Top mistakes in website redesign 17. 6. 2026
Top 6 alternatives to mojaspletka.si agencies 2026 16. 6. 2026
What is included in web hosting? 16. 6. 2026
Benefits of scalable applications for growing businesses 15. 6. 2026
Responsive website design without compromise 15. 6. 2026
The Role of Digital Presence for Business Growth 2026 14. 6. 2026
The Role of Automation in Business: A Guide to 2026 14. 6. 2026
Website user experience counts 13. 6. 2026
Tips for improving your digital presence in 2026 13. 6. 2026
How to prepare content for a website 12. 6. 2026
What is website accessibility: a guide for entrepreneurs 12. 6. 2026
Website maintenance for businesses 11. 6. 2026
Benefits of the Modular Web for Businesses in 2026 11. 6. 2026
Trouble-free maintenance of online systems 10. 6. 2026
Step by step: creating a portal for entrepreneurs 10. 6. 2026
A B2B online store that really accelerates sales 9. 6. 2026
The role of digital strategy for business growth in 2026 9. 6. 2026
Managing website content without chaos 8. 6. 2026
What is an e-commerce platform: a guide for businesses 2026 8. 6. 2026
How to connect an online store to ERP 7. 6. 2026
The Role of Fast Page Loading for Entrepreneurs 2026 7. 6. 2026
Guide to redesigning your business website 6. 6. 2026
Content Editing Steps: A Guide for Businesses 2026 6. 6. 2026
How to improve website conversions 5. 6. 2026
Why use an SSL certificate for a secure website? 5. 6. 2026
A booking system that really saves time 4. 6. 2026
The Role of SEO for Businesses: Growth Strategy 2026 4. 6. 2026
How long does it take to develop a web application? 3. 6. 2026
Web Application Development Guide 2026 3. 6. 2026
Payment system integration for online stores 2. 6. 2026
The Role of Analytics in Digital Business: A Guide to 2026 2. 6. 2026
Website or store - what to choose? 1. 6. 2026
GDPR v spletnem okolju: vodnik za podjetja 2026 1. 6. 2026
How is the development of an online store going? 31. 5. 2026
Top 6 how much does it cost to create an agency website 2026 31. 5. 2026
Online Business Automation Trends 2026 30. 5. 2026
The role of artificial intelligence in the web: a guide to 2026 30. 5. 2026
Website Migration Guide 29. 5. 2026
What is front-end development: a guide for 2026 29. 5. 2026
Online User Experience Trends 2026 28. 5. 2026
Website Design: A Guide for Entrepreneurs 2026 28. 5. 2026
Trends in the development of business portals in practice 27. 5. 2026
List of mandatory online store functionalities 2026 27. 5. 2026
When does it make sense to redesign a website? 26. 5. 2026
What is a landing page and why is it key to sales? 26. 5. 2026
How to design a business website 25. 5. 2026
Website Hosting Guide: Choosing and ManagingWebsite Hosting Guide: Choosing and Managing 25. 5. 2026
How to edit content without a programmer 24. 5. 2026
What is UX on the web: a guide for entrepreneurs 24. 5. 2026
WordPress or custom development? 23. 5. 2026
Individual approach in web development: why it matters 23. 5. 2026
Corporate graphic image price: what influences it 22. 5. 2026
A Guide to Website Design in 2026 22. 5. 2026
Creating a custom website pays off 21. 5. 2026
Website Maintenance Process: A Guide for Businesses 21. 5. 2026
The best functionalities of a business online store 20. 5. 2026
Website Creation Checklist: Guide 2026 20. 5. 2026
Creating online stores for businesses 19. 5. 2026
Website Development: A Practical Guide for Entrepreneurs 19. 5. 2026
Business systems integration without chaos 18. 5. 2026
The most common mistakes in developing web solutions 18. 5. 2026
Website support that really works 17. 5. 2026
Examples of aesthetic website design 17. 5. 2026
B2B portal development guide 16. 5. 2026
Definition of Modern Web Development: A Guide for Entrepreneurs 16. 5. 2026
Pre-built platform or custom solution? 15. 5. 2026
Web application scalability: the key to business growth 15. 5. 2026
How to improve website speed 14. 5. 2026
What is web hosting and how to choose the right solution 14. 5. 2026
A guide to a secure business website 13. 5. 2026
Top 10 online trends for businesses: digital growth 2026 13. 5. 2026
A business website that works for a company 12. 5. 2026
Why test online solutions for business success 12. 5. 2026
Choosing an online store platform 11. 5. 2026
Examples of integrating web tools for efficient business 11. 5. 2026
Graphic design for a company that sells 10. 5. 2026
Step by step to successful web application development 10. 5. 2026
UX design of an online store that sells 9. 5. 2026
What is an online store and how to set one up successfully 9. 5. 2026
Graphic design of the overall image 8. 5. 2026
Investing in a website: The key to business growth 8. 5. 2026
Renovate an outdated website without the guesswork 7. 5. 2026
What is a web application and how does it help your business? 7. 5. 2026
How Website Maintenance Works 6. 5. 2026
Effectively Managing Website Content: A Guide for Businesses 6. 5. 2026
Responsive website for business 5. 5. 2026
What is online branding and how does it improve your appearance? 5. 5. 2026
Custom CMS for your business or off-the-shelf solution? 4. 5. 2026
Business Process Automation with a Web Application 4. 5. 2026
Web architecture: the key to a better online presence 3. 5. 2026
Online store integration with delivery 3. 5. 2026
How to design unique online solutions for business growth 2. 5. 2026
Connecting your online store to your accounting 2. 5. 2026
Explaining modern web applications for business growth 1. 5. 2026
What is e-commerce? Everything SMEs need to know to succeed 1. 5. 2026
Corporate Website Security Without Illusions 30. 4. 2026
Top 4 oxmo.si alternatives 2026 30. 4. 2026
Registering a domain name for your business without mistakes 29. 4. 2026
Static vs. Dynamic Website: What It Means for Your Business 29. 4. 2026
Business Website Hosting 28. 4. 2026
Web Design Trends for a Better Digital Presence 28. 4. 2026
Website Maintenance - Price and Reality 27. 4. 2026
How to Build an Online Store 27. 4. 2026
Top 6 mojbiz.si alternatives 2026 26. 4. 2026
What does building a website involve? 26. 4. 2026
Modern Technologies for Successful Web Development and Growth 25. 4. 2026
When is a custom web application the right choice? 25. 4. 2026
8 Benefits of a Modern Online Store for Business Success 24. 4. 2026
How to Optimize Your Website for Better Results 24. 4. 2026
Creating an online store - price without fog 23. 4. 2026
Why Website Speed Is Key to Success 23. 4. 2026
How much does it cost to create a website?